I was responsible for implementing real-time data-driven visual effects for a permanent exhibition at the
Lisboa Story Centre in Lisbon, Portugal.
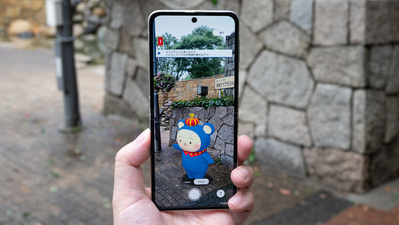
The visuals dynamically reflect live data such as energy, Mobility, and meteorology, while also incorporating visually engaging and varied animations to function as standalone artistic expressions.To accommodate differing data structures across cities, I implemented flexible, scalable systems capable of handling variable input formats.
For example, one visualization depicts the number and speed of buses operating in a given city through dynamic visual representations.
For example, one visualization depicts the number and speed of buses operating in a given city through dynamic visual representations.
ポルトガル・リスボンにある「リスボン・ストーリー・センター」の常設展示にて、エネルギー・交通・気象などのリアルタイムデータを用いたビジュアルエフェクトの実装を担当しました。
各種データに基づいて変化するアニメーションに加え、アート作品として成立するような視覚的な面白さや動きのバリエーションにも注力しています。
また、都市ごとに異なるデータ構成に対応するため、データ構造の可変化や処理の汎用化といった技術的工夫も求められました。
例として、ある都市におけるバスの運行総数や速度に応じた視覚表現などがあります。
例として、ある都市におけるバスの運行総数や速度に応じた視覚表現などがあります。
Technical Breakdown
Links